Multivariate Functional Example#
This notebook will show how to use the fdasrsf package to align and statistically analyze a set of multivariate functions using the SRVF framework
Load Packages#
We will load the required packages and the example data set (MPEG7)
[1]:
import fdasrsf as fs
import matplotlib.pyplot as plt
import numpy as np
data = np.load('../../bin/gait_data.npz',allow_pickle=True)
f = data['f']
g = data['g']
time = data['time']
Now we will construct a 2-D array of a set of 1-D functions from the gait data
[2]:
M,K = f.shape

beta = np.zeros((2,M,K))
beta[0,:,:] = f
beta[1,:,:] = g
Analyze#
We now will construct a fdacurve object
[3]:
obj = fs.fdacurve(beta,N=M)
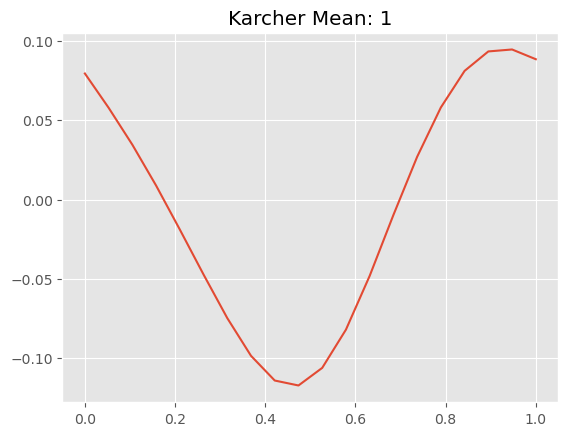
Next, find the Karcher mean and align the curves to the mean
[4]:
obj.karcher_mean(rotation=False)
obj.srvf_align(rotation=False)
Computing Karcher Mean of 39 curves in SRVF space with lam=0.000000
updating step: 1
updating step: 2
updating step: 3
updating step: 4
updating step: 5
updating step: 6
updating step: 7
updating step: 8
updating step: 9
updating step: 10
updating step: 11
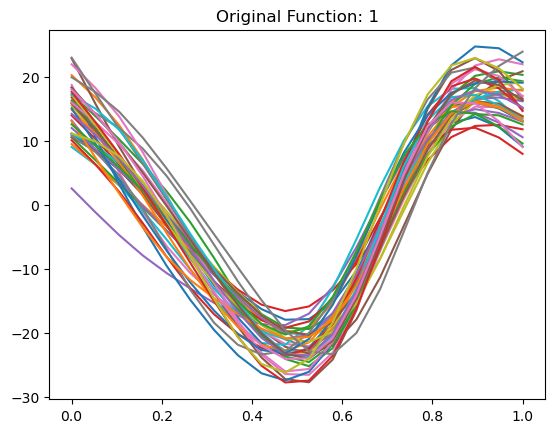
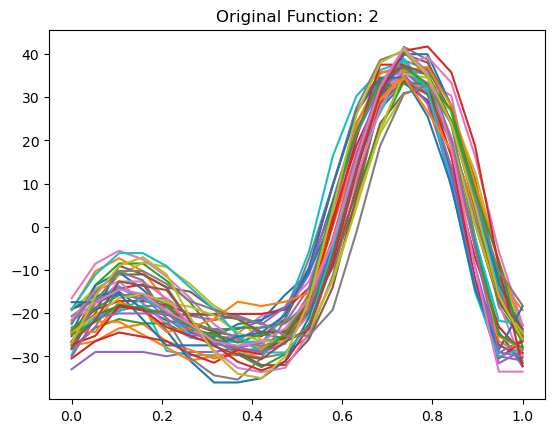
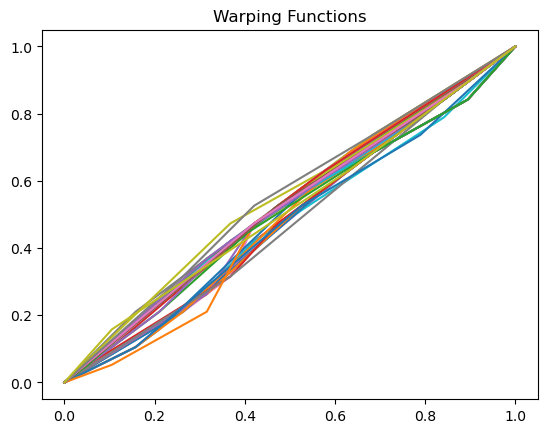
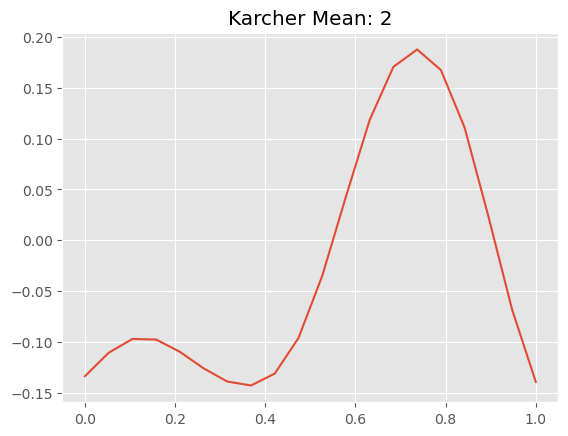
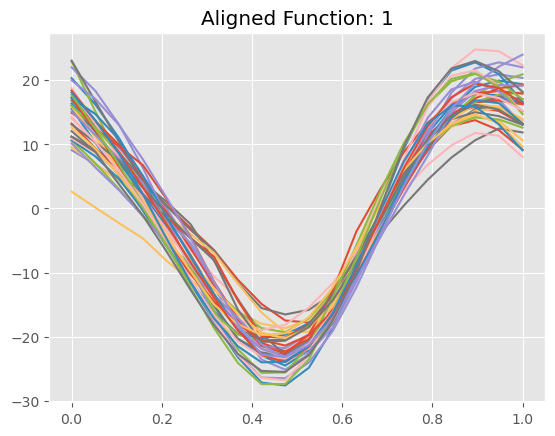
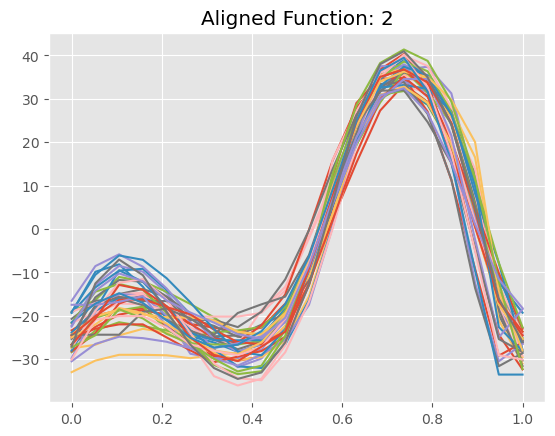
We will now plot the results
[5]:
obj.plot(multivariate=True)
[ ]: